Acknowledgements: Stefan Oehmcke for the code used in this notebook.
This notebook will guide you through a data preprocessing pipeline implementing the CURVE framework you heard about in the lecture.
CURVE: Clean – Unite – Record – Validate – Export
Dataset: Our World in Data (OWID) CO2 + Energy (open, no API key)
Question: Is a higher low-carbon electricity share associated with lower CO2 per capita (2000–2024)?
For all included code, think “What is this doing and why should we do this here?”.
Before we start: Configuration
We recommend placing import statements as well as variables configuring high-level behaviour at the top of your notebooks.
import pandas as pd
import numpy as np
from datetime import date
import platform
import matplotlib.pyplot as plt

YEARS = (2000, 2024)
MISSING_POLICY = "drop"         # options: "drop" | "interpolate"
INTERP_LIMIT = 2                # max consecutive years to fill when interpolating
EXPORT_BASENAME = f"owid_co2_energy_ready_{date.today().isoformat()}"

CO2_URL    = "https://raw.githubusercontent.com/owid/co2-data/master/owid-co2-data.csv"
ENERGY_URL = "https://raw.githubusercontent.com/owid/energy-data/master/owid-energy-data.csv"
C = Clean (load + tidy columns + filter countries/years)
co2_raw = pd.read_csv(CO2_URL)
energy_raw = pd.read_csv(ENERGY_URL)

co2_keep = ["iso_code", "country", "year", "co2_per_capita", "co2"]  # co2 = total Mt (optional)
co2 = co2_raw[co2_keep].copy()

# Ensure year numeric and drop rows missing iso_code/year early
co2["year"] = pd.to_numeric(co2["year"], errors="coerce")
co2 = co2.dropna(subset=["iso_code", "year"]).assign(year=lambda d: d["year"].astype(int))

# Prefer low_carbon_electricity_share; fall back to renewables_share_elec if needed
cands = [c for c in energy_raw.columns if "low_carbon_electricity_share" in c] \
        or [c for c in energy_raw.columns if "renewables_share_elec" in c]
share_col = cands[0]

energy_keep = ["iso_code", "country", "year", share_col, "electricity_demand", "population", "gdp"]
energy = energy_raw[energy_keep].copy()

energy["year"] = pd.to_numeric(energy["year"], errors="coerce")
energy = energy.dropna(subset=["iso_code", "year"]).assign(year=lambda d: d["year"].astype(int))

# Keep only countries (OWID convention: 3-letter ISO codes are countries; others are aggregates)
co2    = co2[co2["iso_code"].astype(str).str.len() == 3]
energy = energy[energy["iso_code"].astype(str).str.len() == 3]

# Year window
co2    = co2.query(f"{YEARS[0]} <= year <= {YEARS[1]}")
energy = energy.query(f"{YEARS[0]} <= year <= {YEARS[1]}")
U = UNITE (inner-join by iso_code + year)
Implement an inner join between the co2 and energy data, matching the ISO code, country and year values.
# TODO
df = None
df = df.rename(columns={share_col: "low_carbon_elec_share"})R = RECORD (note decisions in comments)
What are the data sources?
What major decisions on how to handle the data have been taken?
Was any data removed?
Were data types changed?
Were columns/rows/cells merged or split?
V = VALIDATE
Handling missing data
Add the code path where missing data is being dropped.
req_cols = ["co2_per_capita", "low_carbon_elec_share"]

# Missing data policy: DROP vs INTERPOLATE
if MISSING_POLICY == "drop":
    # TODO
    pass
elif MISSING_POLICY == "interpolate":
    # Interpolate within each country over time (linear), up to INTERP_LIMIT consecutive years
    df = df.sort_values(["iso_code", "year"])
    def _interp_country(g):
        g = g.copy()
        for c in req_cols:
            g[c] = g[c].interpolate(method="linear", limit=INTERP_LIMIT, limit_direction="both")
        # optional: clamp to valid share range after interpolation
        if c == "low_carbon_elec_share":
            g["low_carbon_elec_share"] = g["low_carbon_elec_share"].clip(lower=0, upper=100)
        return g
    na_before = df[req_cols].isna().sum().sum()
    df = df.groupby("iso_code", group_keys=False).apply(_interp_country)
    na_after = df[req_cols].isna().sum().sum()
    print(f"[Missing policy: INTERPOLATE] NA cells before: {na_before}  after: {na_after}")
    # If some NAs remain (long gaps), drop them so validation is simple for students.
    if na_after > 0:
        rows_before = len(df)
        df = df.dropna(subset=req_cols)
        print(f"Remaining NA rows removed after interpolation: {rows_before - len(df)}")
    print("Comment: OK for short, smooth gaps; document the assumption. Avoid long-gap fills or extrapolation.")
else:
    raise ValueError("MISSING_POLICY must be 'drop' or 'interpolate'.")
Check essential properties (Plain asserts for readability)
Implement an assertion, that checks that there are no repeated ISO codes or years.
Implement an assertion, that checks that all values in
low_carbon_elec_shareare within the interval [0,100].
# 1) Keys unique per (iso_code, year)
# TODO

# 2) Required fields not NA
assert ~df[req_cols].isna().any().any(), "Missing values remain in required columns."

# 3) Value ranges
assert (df["co2_per_capita"] >= 0).all(), "Negative CO2 per capita values detected."
# TODO

# 4) Optional plausibility cap (very high extremes rarely occur)
assert df.loc[(df["co2_per_capita"] > 80) | (df["low_carbon_elec_share"] > 100)].empty, "Implausible extremes present."

print("Validation passed ✅")
Validation passed ✅
Quick sanity outputs
n_countries = df["iso_code"].nunique()
n_rows = len(df)
print(f"Countries: {n_countries} | Rows: {n_rows} | Years: [{df['year'].min()}–{df['year'].max()}]")
# Simple correlation (pooled; not causal)
corr = df[["co2_per_capita", "low_carbon_elec_share"]].corr().iloc[0,1]
print(f"Pearson corr(co2_per_capita, low_carbon_elec_share) = {corr:.3f}")
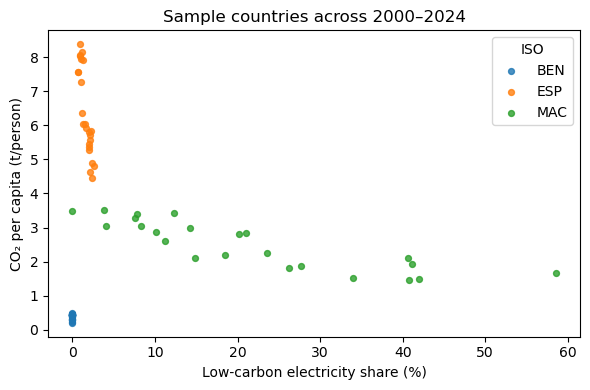
# Tiny scatter for a feel (random 3 countries)
sample_c = df["iso_code"].drop_duplicates().sample(n=min(3, n_countries), random_state=0).tolist()
sub = df[df["iso_code"].isin(sample_c)]
plt.figure(figsize=(6,4))
for c in sample_c:
cc = sub[sub["iso_code"]==c]
plt.scatter(cc["low_carbon_elec_share"], cc["co2_per_capita"], label=c, s=18, alpha=0.8)
plt.xlabel("Low-carbon electricity share (%)")
plt.ylabel("CO₂ per capita (t/person)")
plt.title("Sample countries across 2000–2024")
plt.legend(title="ISO")
plt.tight_layout()
plt.show()Countries: 201 | Rows: 4758 | Years: [2000–2023]
Pearson corr(co2_per_capita, low_carbon_elec_share) = -0.068
E = EXPORT (freeze)
Save the contents of df in CSV format without the index.
Reproduction notes (helpful printout)
Print version information for your installation of Python as well as used packages.
Print configuration values.
Print column names, that you saved in the previous step.